Structural drivers of the 2026 supercycle
The current market phase is defined by a convergence of three structural forces: deglobalization, decarbonization, and artificial intelligence infrastructure. These drivers create a sustained demand floor that moves beyond traditional cyclical noise. The result is a "Supercycle 2.0," characterized by longer-lasting price elevations and tighter supply constraints across critical materials.
Deglobalization has fragmented supply chains, forcing nations to prioritize security over efficiency. This shift has increased the cost of logistics and created persistent bottlenecks in the movement of raw materials. Decarbonization adds another layer of demand, as the transition to renewable energy requires massive amounts of copper, lithium, and rare earth elements. These metals are not substitutes for traditional industrial inputs; they are foundational to the new energy grid.
AI infrastructure serves as the third pillar. Data centers require immense power, driving up electricity demand and necessitating upgrades to transmission networks. This infrastructure build-out competes for the same industrial metals needed for green energy, tightening the available supply further. The interaction between these forces creates a high-stakes environment where small shifts in allocation can have outsized impacts on price.
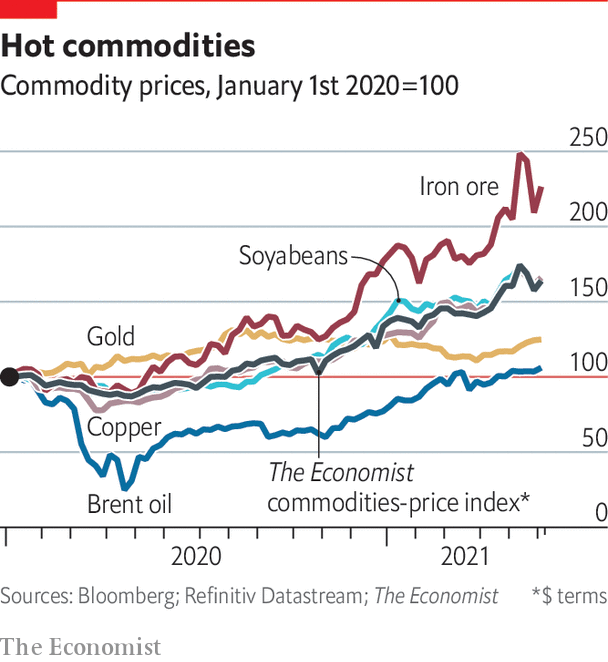
To visualize this multi-year uptrend, we look at the broader commodity index. The following chart illustrates the long-term trajectory of the S&P GSCI, confirming the structural nature of this supercycle.
Why rare earths and lithium lead the charge
The current market environment is defined by a structural mismatch between critical mineral supply and the accelerating demands of decarbonization and artificial intelligence infrastructure. Unlike cyclical commodities that fluctuate with global GDP growth, rare earths and lithium operate under rigid supply constraints that create a permanent pricing floor. This imbalance is not temporary; it is the result of decades of underinvestment in extraction and processing capacity, now colliding with mandated green energy adoption.
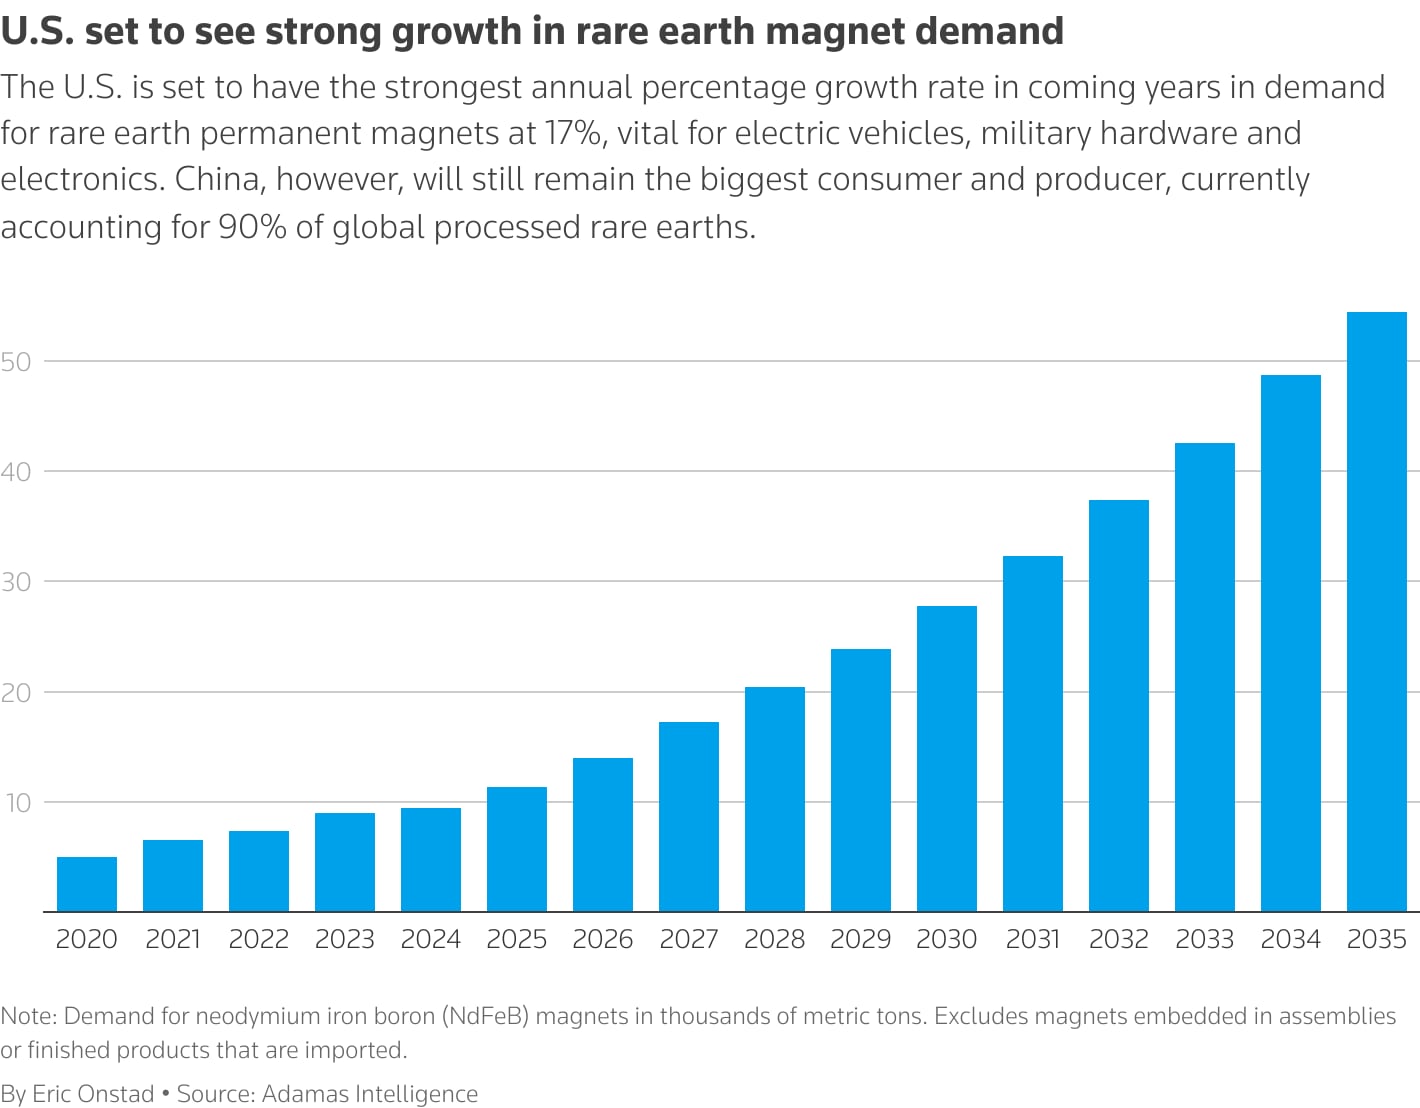
Geopolitical concentration acts as a powerful constraint on supply elasticity. China controls approximately 60% of global rare earth mining and nearly 90% of processing capacity, while lithium production is similarly concentrated in a few key jurisdictions. This centralization means that trade policies, export restrictions, or domestic environmental regulations in a single country can instantly tighten global availability. For investors, this translates to a market where demand shocks cannot be met by rapid supply expansion, keeping volatility high and prices elevated relative to historical averages.
The demand side is equally inelastic. Electric vehicle mandates and grid modernization projects require fixed quantities of lithium-ion batteries and neodymium-based magnets, regardless of price fluctuations in the short term. Manufacturers cannot substitute these materials easily without compromising performance or violating regulatory standards. Consequently, the pricing mechanism for these metals is driven more by strategic necessity than by speculative trading, reinforcing their role as foundational inputs for the new industrial era.
The following comparison illustrates the distinct risk and growth profiles of these critical metals against a broader industrial benchmark.
| Material | Supply Risk | Demand Growth (2026) | Geopolitical Concentration |
|---|---|---|---|
| Lithium | High | ~25% CAGR | Moderate (Chile, Australia, China) |
| Rare Earths | Very High | ~15% CAGR | Very High (China dominance) |
| Copper | Moderate | ~4% CAGR | Low (Diverse producers) |
Gold and copper as the supercycle anchors
In a commodity supercycle, gold and copper serve as structural anchors, providing stability where speculative growth metals like lithium or rare earths often face volatility. While new energy metals drive narrative excitement, gold and copper offer tangible inflation hedging and industrial certainty. Their roles are distinct: gold protects purchasing power against currency debasement, while copper signals the underlying health of global manufacturing and infrastructure.
Gold has recently reawakened the supercycle narrative, with prices topping $5,000 in early 2026 as central banks continued aggressive accumulation. This move reflects a shift away from fiat reliance toward hard assets, a trend reinforced by silver’s surge to nearly $110 per ounce. The metal’s stability is not merely speculative; it is a direct response to macroeconomic uncertainty and the erosion of real yields.
Copper complements this dynamic as the "dr. copper" of the economy. Its price action, often jumping 5.3% in single weeks, mirrors the physical demand for electrification and grid modernization. Unlike rare earths, which suffer from concentrated supply chains and geopolitical friction, copper’s demand is diffuse and essential. This makes it a more reliable anchor for institutional portfolios seeking exposure to the physical transition without the idiosyncratic risks of niche mineral markets.
Positioning for the Commodity Supercycle
Participating in a commodity supercycle requires shifting from speculative trading to structural allocation. The current market environment is defined by small pool dynamics, where limited supply elasticity means that incremental demand shifts from energy transition and infrastructure projects can drive disproportionate price appreciation. Investors must treat these assets as long-duration holdings rather than short-term trades, aligning portfolios with the multi-year capital expenditure cycles of mining and refining operations.
The following steps outline a disciplined approach to building exposure while managing the inherent volatility of raw materials.
Evaluate the specific constraints facing key metals. For instance, rare earth processing remains concentrated in a few geographic hubs, creating structural barriers to entry that support price floors. Similarly, lithium extraction faces permitting delays that extend project timelines well beyond initial forecasts. Focus on assets with proven reserves and existing infrastructure rather than exploration-stage equities.
Do not concentrate exposure solely on upstream miners. Midstream processing and downstream manufacturing often capture stable margins during supply disruptions. A balanced portfolio might include producers of refined lithium salts or rare earth magnets, which benefit from both commodity price appreciation and the volume growth of end-user industries like electric vehicles and renewable energy storage.
Track the allocation shifts of sovereign wealth funds and large commodity pools. As noted by market analysts, small changes in institutional positioning can signal broader trend shifts. Use tools like the
to gauge long-term momentum in broad commodity indices, ensuring your entry points align with institutional accumulation phases rather than retail-driven spikes.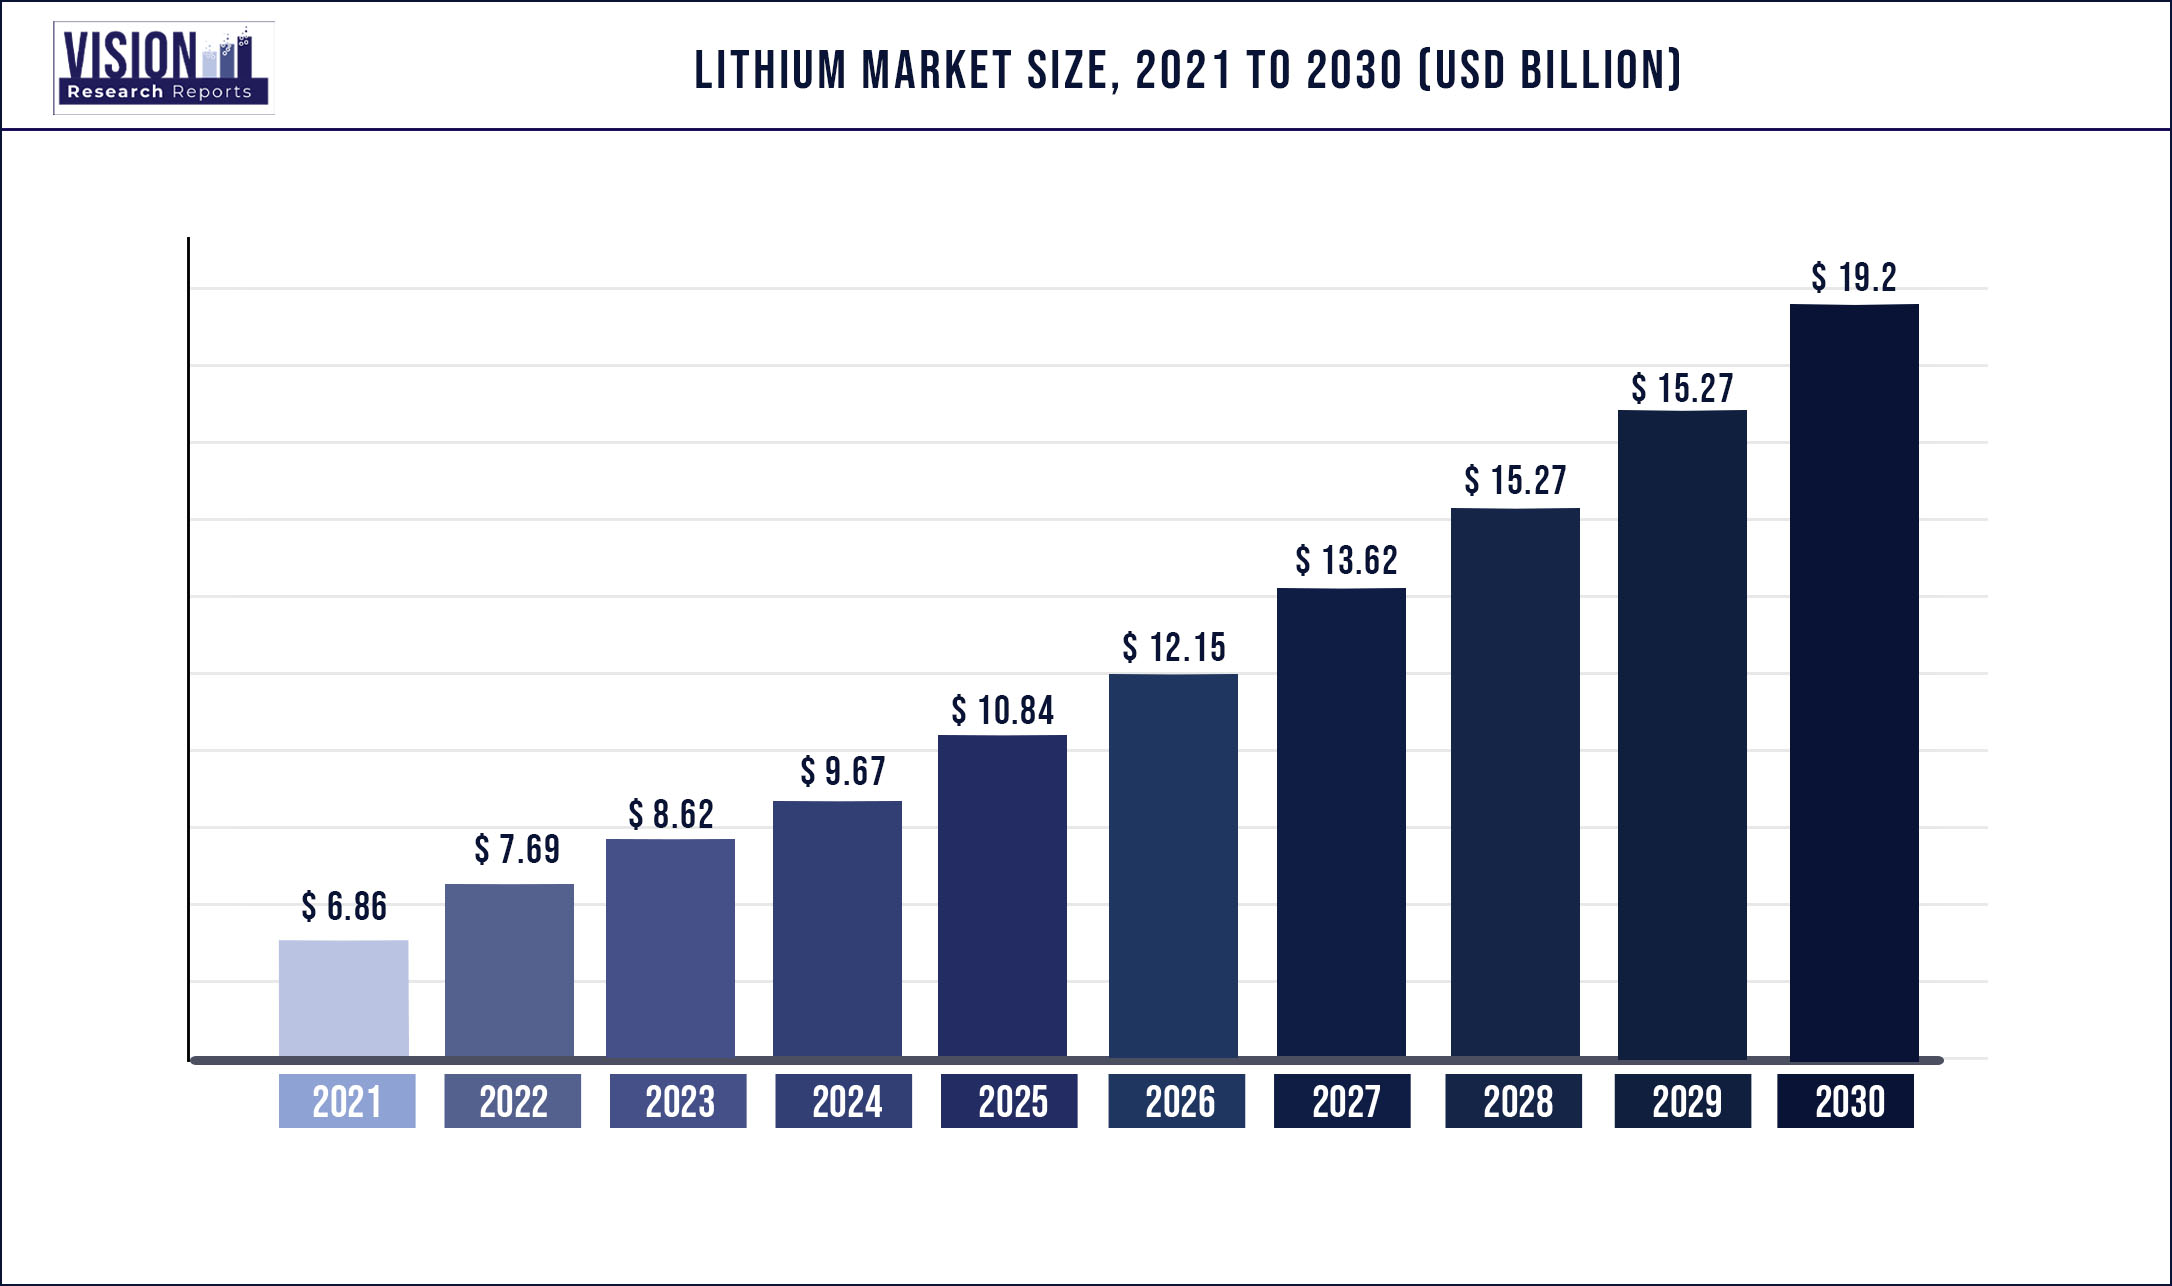
Commodity prices are subject to sudden corrections based on macroeconomic data or policy changes. Use stop-loss orders and position sizing to limit downside risk. Consider hedging strategies through futures contracts or options if your portfolio is heavily weighted toward single-commodity producers. This is not about timing the market, but about surviving the volatility inherent in a high-stakes structural shift.
By adhering to these steps, investors can manage the complexities of the commodity supercycle with a focus on fundamental value and long-term structural tailwinds.
Forecasting Commodity Index Performance
Reconciling the current macro outlook requires navigating a sharp divergence between institutional projections and bullish market sentiment. The World Bank’s October 2025 Commodity Markets Outlook projects a structural decline, forecasting that global commodity prices will hit their lowest level in six years by 2026. This four-year downward trajectory is driven by easing supply constraints in energy and fertilizer markets, alongside a normalization of post-pandemic logistics chains. For index trackers, this implies a sustained pressure on price floors, particularly for bulk commodities where inventory overhang remains a persistent risk.
Conversely, bullish analysts point to the structural deficits in the critical minerals sector as a hedge against broader macro weakness. While bulk commodities face oversupply, the transition to renewable energy infrastructure is creating inelastic demand for lithium, cobalt, and rare earths. This bifurcation suggests that broad commodity indices may underperform relative to specialized metal benchmarks. The "new metal hierarchy" is not yet reflected in general indices, creating a potential mispricing opportunity for investors who distinguish between cyclical bulk goods and strategic industrial inputs.
To ground these forecasts in real-time data, we monitor provider-backed charts for key benchmark assets. The following chart tracks the broader energy and industrial complex, reflecting the structural headwinds cited by major institutions.
Investors should view these conflicting signals not as a binary choice, but as a mandate for selective exposure. While the World Bank’s forecast highlights the vulnerability of energy-dependent indices, the supply bottlenecks in rare earths and lithium suggest that price floors for strategic metals will remain elevated. The 2026 market will likely be defined by this split: declining bulk volumes against rising strategic scarcity.
Common questions about the 2026 commodity outlook
The 2026 commodity outlook presents a stark divergence in institutional forecasts, reflecting the tension between structural supply deficits and cyclical demand pressures. Investors are currently weighing conflicting signals from major financial institutions regarding index trajectories and downside risks.
These conflicting data points underscore the complexity of the current market. The divergence between the April and October outlooks suggests that short-term demand shocks are currently outweighing long-term structural supply constraints in some models, while others prioritize the inevitable inflationary pressure of raw material scarcity.
No comments yet. Be the first to share your thoughts!