Disclaimer:This technical analysis by Alicia Monroe is for educational purposes only and should not be considered as financial advice.Trading involves risk,and you should always do your own research before making investment decisions.Past performance does not guarantee future results.The analysis reflects the author's personal methodology and risk tolerance(medium). PAXG vs XAUT vs XAUm: Comparing Leading DeFi Gold Tokens
The three most prominent gold-backed crypto assets reshaping the market are:
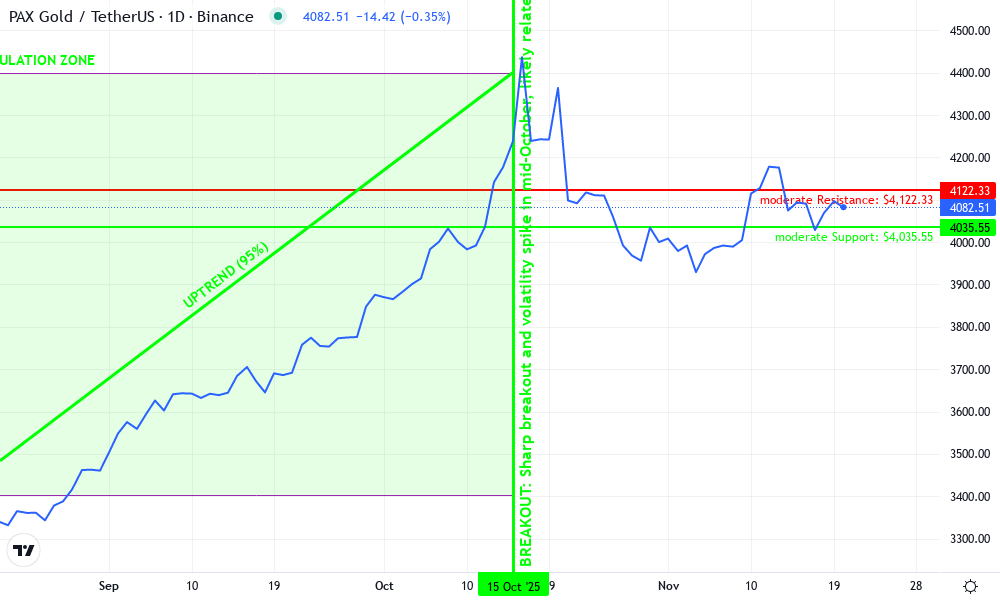
- PAX Gold (PAXG): Issued by Paxos Trust Company and trading at $4,076.61, PAXG is renowned for its regulatory clarity and ease of redemption for London Good Delivery bars.
- Tether Gold (XAUT): Launched by Tether Holdings, XAUT offers fractional ownership down to six decimal places, making it accessible for both retail and institutional participants seeking micro-exposure.
- Matrixdock XAUt (XAUm): XAUm stands out for its seamless cross-chain capabilities across Ethereum, BNB Chain, Plume, Tron, and HashKey Chain. Its integration with protocols like Chainlink CCIP ensures supply integrity across networks, a crucial feature as DeFi moves toward interoperability.
| PAX Gold (PAXG) | $4,078.34 | $3,745.00 | +8.9% |
| Tether Gold (XAUT) | $4,073.85 | $3,737.00 | +9.0% |
| Matrixdock Gold (XAUm) | $4,048.01 | $3,700.00 | +9.4% |
| Bitcoin (BTC) | $91,913.00 | $60,000.00 | +53.2% |
| Ethereum (ETH) | $3,033.76 | $1,805.00 | +68.1% |
| SPDR Gold Shares ETF (GLD) | $374.96 | $350.00 | +7.1% |
| AurusGOLD (AUX) | $4.25 | $4.00 | +6.3% |
Analysis Summary
Over the past six months, tokenized gold assets such as PAX Gold (PAXG), Tether Gold (XAUT), and Matrixdock Gold (XAUm) have appreciated by approximately 9%, closely tracking the performance of physical gold (GLD ETF, +7.1%). In contrast, major cryptocurrencies like Bitcoin (+53.2%) and Ethereum (+68.1%) have significantly outperformed both tokenized and traditional gold assets, reflecting strong bullish sentiment in the broader crypto market.
Key Insights
- Tokenized gold assets (PAXG, XAUT, XAUm) have closely mirrored the price appreciation of physical gold, offering digital convenience and on-chain liquidity.
- Matrixdock Gold (XAUm) led tokenized gold assets with a 9.4% gain, slightly outperforming PAXG and XAUT.
- Bitcoin and Ethereum have dramatically outperformed gold-backed tokens and traditional gold, highlighting the higher volatility and growth potential of major cryptocurrencies.
- Tokenized gold's market cap tripled in 2025, driven by institutional adoption and DeFi integration, despite price changes remaining in line with spot gold.
- AurusGOLD (AUX) showed the smallest gain among gold-backed tokens, reinforcing the importance of liquidity and adoption.
All prices and 6-month changes are sourced directly from real-time market data as of November 20, 2025. The table compares current and 6-month historical prices for each asset, calculating the percentage change over the period. No estimates or external data were used.
Data Sources:
- Main Asset: https://coinmarketcap.com/currencies/pax-gold/
- Tether Gold: https://coinmarketcap.com/currencies/tether-gold/
- Matrixdock Gold: https://coinmarketcap.com/currencies/matrixdock-gold/
- Bitcoin: https://coinmarketcap.com/currencies/bitcoin/
- Ethereum: https://coinmarketcap.com/currencies/ethereum/
- SPDR Gold Shares ETF: https://finance.yahoo.com/quote/GLD/
- AurusGOLD: https://coinmarketcap.com/currencies/aurusgold/
Disclaimer: Cryptocurrency prices are highly volatile and subject to market fluctuations. The data presented is for informational purposes only and should not be considered as investment advice. Always do your own research before making investment decisions.
The Real-World Impact: Liquidity and Transparency Redefined
Tokenization has dramatically improved liquidity for what was once a slow-moving asset class. On-chain trading allows gold tokens to be swapped around the clock on decentralized exchanges or used instantly as collateral in lending protocols, no more waiting days for settlement or dealing with opaque ownership records.
This transparency isn’t just theoretical; every transaction is recorded on public blockchains where proof-of-reserves audits can be run in real time. Investors can verify that each token remains fully backed by audited vault holdings, an assurance that’s especially valuable during times of financial uncertainty or inflation spikes.
Pax Gold (PAXG) Price Prediction 2026-2031
Forecasts based on 2025 market context, DeFi integration, and tokenized gold adoption trends
| Key Market Scenario |
|---|
| 2026 | $3,950 | $4,180 | $4,480 | +2.5% | Continued institutional DeFi adoption; gold price stable |
| 2027 | $3,900 | $4,310 | $4,750 | +3.1% | Expanded cross-chain liquidity; spot gold uptrend |
| 2028 | $3,850 | $4,465 | $5,100 | +3.6% | Programmable gold collateral boom; regulatory clarity |
| 2029 | $3,800 | $4,600 | $5,450 | +3.0% | Integration with global finance; minor tech setbacks |
| 2030 | $3,750 | $4,740 | $5,800 | +3.0% | DeFi mainstream adoption; gold as global hedge |
| 2031 | $3,700 | $4,880 | $6,200 | +2.9% | Stable DeFi growth; tokenized gold market matures |
Price Prediction Summary
Pax Gold (PAXG) is projected to maintain a stable-to-moderately-bullish trajectory through 2031, closely tracking the underlying spot gold price while benefiting from expanding DeFi use cases, cross-chain integrations, and institutional adoption. The average price is forecast to grow modestly year-over-year, reflecting both gold's traditional stability and the rising demand for tokenized assets in the digital economy. Bearish scenarios consider potential regulatory or smart contract risks, while bullish outcomes assume continued DeFi innovation and global gold demand.
Key Factors Affecting Pax Gold Price
- Spot gold price trends and macroeconomic conditions
- Institutional adoption of tokenized gold in DeFi and TradFi
- Cross-chain interoperability and supply integrity via protocols like Chainlink CCIP
- Regulatory developments around asset tokenization and stablecoins
- Smart contract security and infrastructure robustness
- Relative liquidity and market depth compared to traditional gold markets
- Competition from other tokenized commodity assets
- Global geopolitical tensions and inflationary pressures
Disclaimer: Cryptocurrency price predictions are speculative and based on current market analysis.
Actual prices may vary significantly due to market volatility, regulatory changes, and other factors.
Always do your own research before making investment decisions.
Beyond liquidity and transparency, tokenized gold is making waves for its programmable features. Unlike traditional gold ETFs or certificates, today’s DeFi gold tokens can be integrated into automated strategies: think yield generation, dynamic portfolio rebalancing, or instant cross-chain transfers. For instance, XAUm’s multi-chain expansion means users can move their gold-backed assets between Ethereum, BNB Chain, Tron, and more with minimal friction, unlocking opportunities wherever liquidity and yield are highest.
Security remains front and center. Each of these leading tokens, PAXG, XAUT, XAUm, relies on independent audits and robust smart contract infrastructure to safeguard user funds. PAX Gold (PAXG), for example, publishes monthly attestations from top-tier auditors confirming every token is backed by real London Good Delivery bars. Tether Gold (XAUT) provides detailed vaulting reports and redemption options for those seeking physical delivery. Meanwhile, Matrixdock XAUm leverages advanced cross-chain protocols like Chainlink CCIP and LayerZero to ensure that the circulating supply always matches underlying reserves, even as assets flow across blockchains.
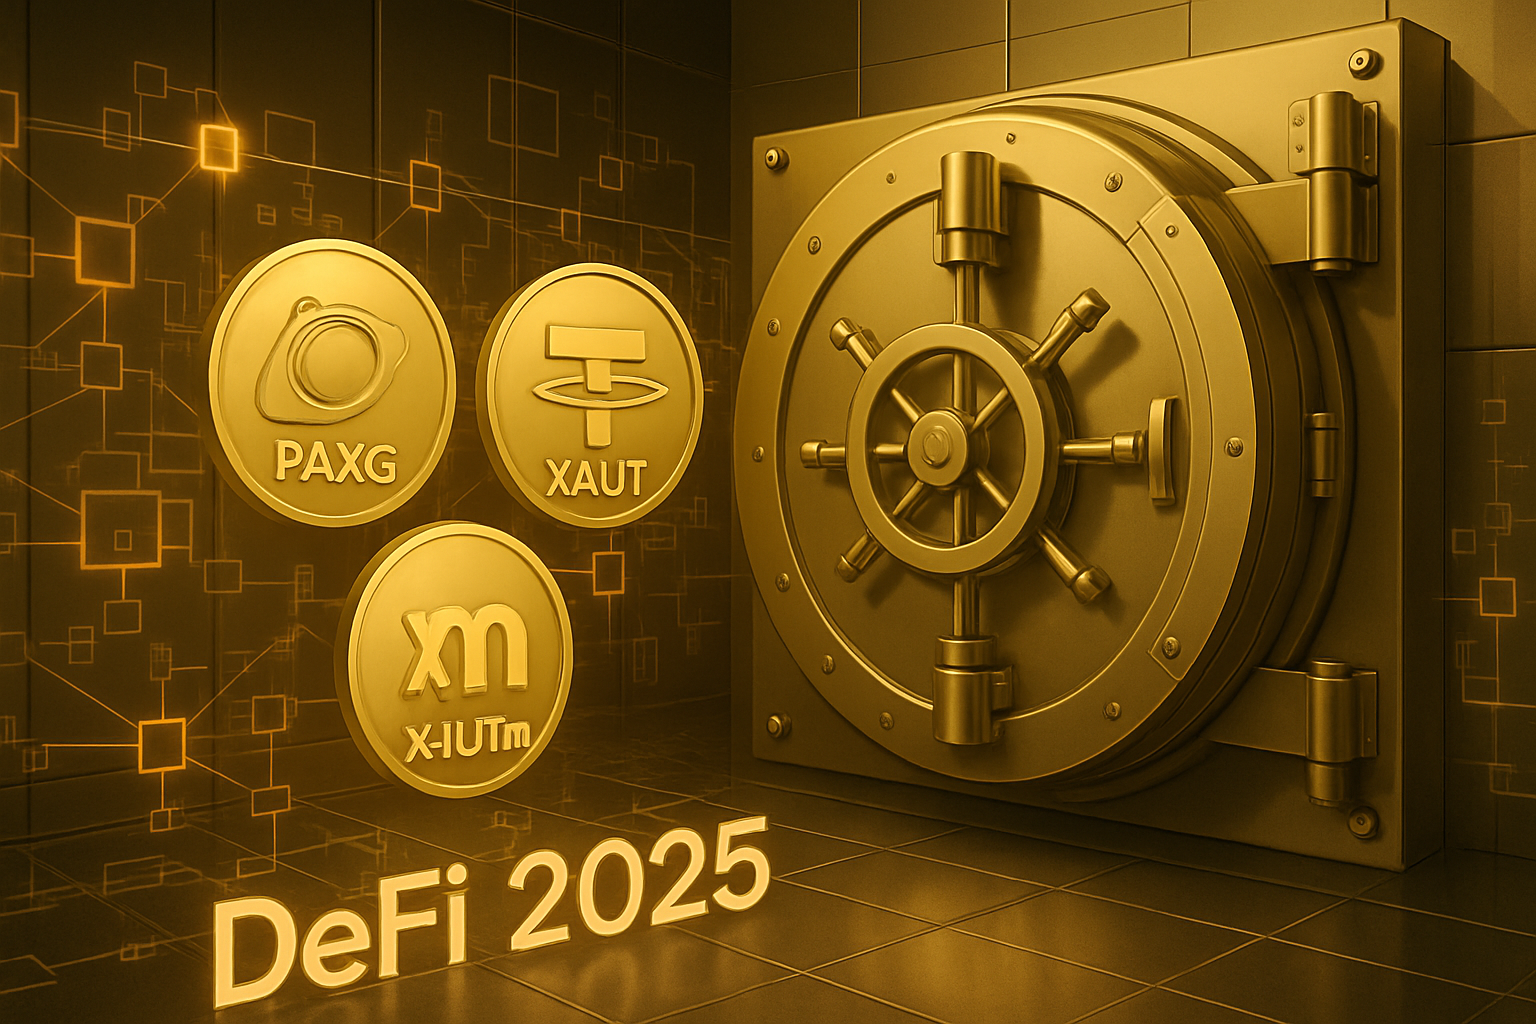
Why Tokenized Gold Is Gaining Traction in 2025
The recent surge to a $3.5 billion market cap signals not just hype but a fundamental shift in how investors view gold’s role in a digital-first portfolio. As spot gold prices remain strong and macro volatility persists globally, on-chain gold offers a rare blend of stability and utility. It’s an inflation hedge that also serves as productive collateral, a combination that’s hard to match in either traditional finance or crypto-native markets.
For many DeFi participants, the appeal lies in the ability to access global liquidity pools without borders or banking hours. With PAXG trading at $4,076.61, investors can enter or exit positions instantly, no need to wait for legacy clearing cycles or wire transfers. XAUT’s micro-ownership model makes it possible for anyone, from high-net-worth individuals to everyday savers, to gain exposure without hefty minimums or paperwork headaches.
The integration of tokenized gold into lending protocols is especially noteworthy this year. Platforms like RAAC are at the forefront of enabling users to borrow stablecoins against their XAUm holdings, unlocking capital while retaining upside exposure to physical bullion. SmartGold’s partnership with Chintai Nexus further demonstrates how IRA-held gold can now earn real yields through DeFi strategies without sacrificing tax efficiency.
Challenges on the Horizon
No revolution comes without obstacles. While liquidity has improved dramatically since 2024, tokenized gold markets still trail global spot volumes by a wide margin. Smart contract vulnerabilities remain a risk; ongoing audits and upgrades are essential as adoption scales up. Regulatory clarity is also evolving, especially as more jurisdictions grapple with the intersection of securities law and digital assets.
Yet these hurdles haven’t slowed momentum, institutional inflows continue to rise and new integrations roll out almost monthly.
What’s Next for On-Chain Gold?
The next phase for tokenized gold will likely focus on deeper interoperability and even greater transparency standards. Expect continued expansion onto new blockchains, more sophisticated proof-of-reserves models (potentially leveraging zero-knowledge proofs), and broader integration with both institutional custody platforms and retail-facing wallets.
For investors tracking this space, or considering their first allocation, the key takeaway is clear: PAXG, XAUT, and XAUm aren’t just digital wrappers around old-school bullion; they’re programmable financial primitives reshaping what it means to own “digital gold. ” Whether you’re seeking inflation protection, DeFi yield opportunities, or simply frictionless cross-border asset transfers, these tokens offer unprecedented flexibility, and they’re only getting stronger as adoption grows.
If you want a deeper dive into how these platforms function under the hood or tips on integrating tokenized gold into your portfolio strategy, check out our feature: How Tokenized Gold Works: Platforms, Issuers and Integration With DeFi.





No comments yet. Be the first to share your thoughts!