The 2026 price divergence
The global commodity market in 2026 is defined by a sharp split between industrial metals and energy. While the broader commodity index faces downward pressure from moderating energy and agricultural prices, metals are surging. This divergence creates a complex trading environment where broad indices mask significant sector-specific volatility.
Industrial materials prices increased more than 10% in the first quarter of 2026 and are forecast for another double-digit rise, driven by persistent supply constraints and steady demand (S&P Global). In contrast, global commodity prices are projected to decline by about 7% overall, marking the fourth consecutive year of moderation as energy and agriculture weaken (World Bank). This means that while the headline commodity number may look soft, the metal complex is experiencing a distinct boom.
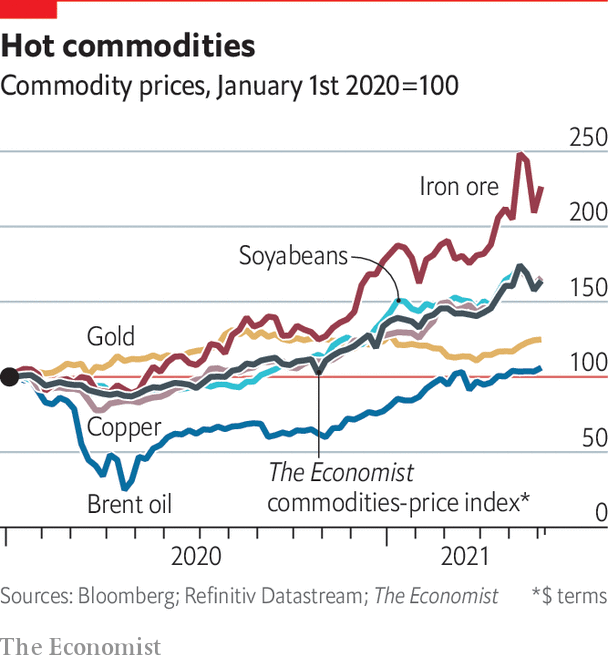
The chart below illustrates this split. The S&P GSCI Industrial Metals index is trending upward, decoupling from the Energy component, which has been dragged lower by global supply normalization.
This divergence is not temporary. Oxford Economics expects metals to continue outperforming throughout 2026, while energy and agricultural commodities remain under pressure. Investors and industrial buyers must therefore look beyond the aggregate commodity index to understand true market direction. A broad decline in energy prices does not signal a bear market for industrial inputs; it signals a shift in where value is concentrated.
Industrial metals drive the rally
Industrial materials are leading the commodity recovery in 2026, with prices rising more than 10% in the first quarter alone and forecast to continue climbing. This divergence from weakening energy and agriculture is structural, not cyclical. The primary driver is the accelerating electrification of the global economy, which has created a rigid demand floor for copper and lithium that existing supply chains cannot easily meet.
Copper remains the anchor of this rally. As the backbone of electrical grids, EVs, and renewable infrastructure, its demand has outpaced new mine production for years. The gap between supply and demand is widening, pushing prices to levels that reflect long-term scarcity rather than short-term speculation. This dynamic is visible in the live pricing data, where copper futures consistently trade at a premium to broader industrial indices.
Lithium and other battery metals are following a similar trajectory, though with higher volatility. While lithium prices corrected sharply in 2023–2024, 2026 sees a rebound as EV adoption hits critical mass in key markets. The supply side is constrained by long lead times for new mines and processing facilities, meaning demand spikes translate quickly into price increases. This structural tightness is why metals are expected to outperform other commodity classes this year.
The combination of green energy mandates and infrastructure spending has created a "supercycle" environment for industrial metals. Unlike previous cycles driven by general economic expansion, this one is driven by a mandatory transition to low-carbon technologies. This ensures that demand growth is less sensitive to short-term economic fluctuations, providing a more stable, albeit higher-priced, market for miners and investors alike.
Energy and agriculture moderate
While metals are capturing headlines with their rally, the broader commodity landscape tells a different story. The World Bank projects a 7 percent decline in global commodity prices in 2026, marking the fourth consecutive year of moderation. This overall drop is driven primarily by energy and agriculture, which are expected to weaken as global supply chains stabilize and demand growth slows in key economies.
Energy prices, which have been volatile in recent years, are forecast to ease. The International Energy Agency notes that increased production from non-OPEC countries, particularly the United States and Brazil, is helping to balance the market. This surplus, combined with a gradual shift toward renewable energy sources in major economies, is putting downward pressure on oil and natural gas prices. For investors tracking energy trends, this moderation suggests a return to more predictable pricing models, reducing the risk premiums that have characterized the sector in recent years.
Agricultural commodities are also facing headwinds. Favorable weather conditions in major producing regions like the US Midwest and South America have led to bumper harvests for key crops such as corn and soybeans. This abundance is expected to keep food prices stable or lower, benefiting consumers but challenging farmers who are already operating on thin margins. The contrast between the strength of industrial metals and the softness of energy and agriculture highlights the diverging paths within the commodity complex in 2026.
| Sector | 2026 Forecast | Primary Driver |
|---|---|---|
| Energy | -5% to -8% | Increased non-OPEC supply |
| Agriculture | -3% to -6% | Bumper harvests in key regions |
| Industrial Metals | +10% to +15% | Green energy demand |
Macro factors supporting metals
Commodity prices do not move in a vacuum. They are pulled by the tides of global liquidity, economic expansion, and currency strength. In 2026, three macro forces are converging to support metal valuations: accommodative monetary policy, steady global growth, and a weakening U.S. dollar.
Federal Reserve rate cuts
The Federal Reserve’s projected 50 basis points of rate cuts in 2026 are a primary tailwind for metals. Lower interest rates reduce the "carry cost" of holding non-yielding assets like gold and copper. As borrowing costs decline, industrial demand typically picks up, further supporting base metals. Goldman Sachs notes that this cyclical macro base case is "supportive of top-down commodity returns" [src-serp-8].
Global GDP growth
Sturdy global GDP growth provides the fundamental demand necessary to absorb supply constraints. Unlike previous cycles driven solely by speculation, 2026’s price support is backed by real economic activity. This growth is particularly strong in emerging markets, where infrastructure development drives long-term copper and aluminum consumption. The World Bank’s April 2026 outlook forecasts a 16% rise in overall commodity prices, driven in part by record-high metal prices [src-serp-2].
The U.S. dollar impact
The U.S. dollar’s trajectory is the final piece of the puzzle. Metals are priced in dollars globally, so a weaker currency makes commodities cheaper for foreign buyers, boosting demand. As the Fed cuts rates, the dollar typically softens relative to other major currencies. This dynamic creates a favorable environment for metal prices to rise even if physical demand remains flat.
Key questions on 2026 prices
The global commodity market is navigating a period of sharp divergence in 2026. While some segments face prolonged downturns, others are experiencing significant upward pressure. Understanding these specific price trajectories is essential for investors and industry stakeholders tracking the evolving landscape.
These conflicting signals highlight the complexity of the 2026 market. Energy and fertilizers are pushing indices up, while base metals and agricultural products continue to face downward pressure. Investors must look beyond aggregate numbers to understand where value lies.
No comments yet. Be the first to share your thoughts!