
Commodity prices 2026: the big picture
The global commodity market is set for a significant shift in 2026, with overall prices forecast to rise by approximately 16% according to the World Bank. This broad increase is not uniform; it is driven primarily by soaring energy costs and record-high prices for several key metals, creating a complex landscape for investors and industrial buyers alike.
A clear divergence is emerging between energy and industrial metals. While crude oil is expected to see substantial upward pressure, most globally traded industrial commodities are projected to remain flat to slightly upward. This split highlights the unique pressures facing the energy sector compared to the more stable, albeit still elevated, trajectory of base industrial materials.
To visualize this volatility, the chart below tracks the Bloomberg Commodity Index, providing a provider-backed view of the market trends shaping 2026.
This environment requires careful navigation. The 16% aggregate rise masks the underlying structural differences: energy markets are reacting to supply constraints and geopolitical tensions, while industrial metals are balancing steady demand against efficient supply chains. Understanding this split is essential for positioning portfolios and managing input costs in the year ahead.
Copper demand forecast: infrastructure tailwinds
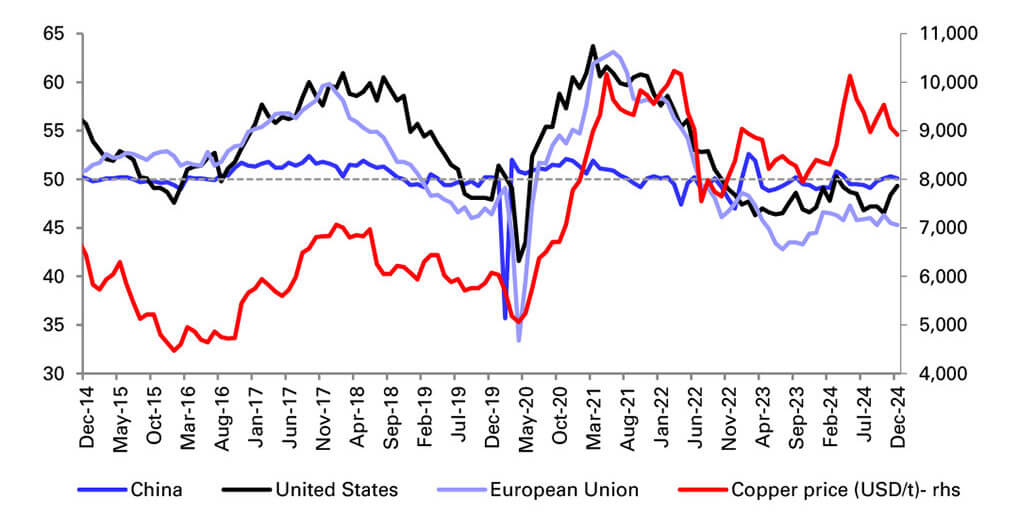
Copper prices in 2026 are anchored by a structural demand surge that outpaces recent supply additions. The metal remains the primary conduit for global electrification, driven by renewable energy installations, electric vehicle production, and extensive grid modernization efforts. Morgan Stanley notes that base metal prices are expected to remain broadly stable or rise modestly, reflecting this firm demand base as the decade progresses. This optimism is not merely cyclical; it is rooted in the physical constraints of mining new deposits while demand accelerates.
The energy transition is the dominant narrative for copper demand. Grid infrastructure projects require significant copper wiring and transformer components to handle increased electricity loads. Meanwhile, the shift to electric vehicles doubles the copper content per unit compared to internal combustion engines. These sectors are creating a sustained floor for consumption, insulating the market from short-term economic fluctuations. The result is a market where demand growth is predictable, even if mine supply remains constrained by permitting delays and declining ore grades.
While demand provides the engine, supply constraints act as the throttle. Major copper-producing regions face operational challenges, from water scarcity in Chile to labor disputes in Africa. These bottlenecks prevent rapid supply responses to price signals, keeping the market tight. As infrastructure projects accelerate globally, the gap between available supply and required volume is expected to narrow further, supporting price stability or modest gains throughout 2026. This dynamic creates a favorable environment for copper, distinguishing it from other commodities facing softer demand outlooks.
Lithium Market Trends: Battery Storage Shifts
Lithium’s role in the global energy transition is undergoing a structural shift. While electric vehicle adoption remains the primary driver of demand, the growth rate of battery electric vehicles (BEVs) has moderated in several key markets. This deceleration has prompted a recalibration of lithium forecasts, moving the focus from pure EV volume to a more diversified demand base. The market is no longer defined solely by the race for the next million cars, but by the broader electrification of the grid and stationary storage systems.
Stationary energy storage is emerging as the second pillar of lithium demand. As renewable energy penetration increases, the need for grid-scale battery storage to manage intermittency has grown significantly. This sector is absorbing a larger share of lithium supply, providing a buffer against volatility in the automotive sector. The transition from EV-centric demand to a hybrid model of transport and storage is reshaping long-term consumption patterns.
On the supply side, the market is experiencing a normalization phase. After years of severe deficits and price spikes, new production capacity from Australia, South America, and China has come online. This influx of supply has eased the immediate shortage, leading to a stabilization of prices. However, the market remains sensitive to geopolitical factors and production delays in major mining jurisdictions.
Price signals reflect this balanced but cautious outlook. Lithium carbonate prices have retreated from their 2022 peaks, settling into a range that supports sustainable mining economics without stifling demand. Investors and producers are watching these levels closely, as they determine the viability of new projects and the pace of industry consolidation.

Energy sector volatility: oil and gas dynamics
Use this section to make the Commodity Prices decision easier to compare in real life, not just on paper. Start with the reader's actual constraint, then separate must-have requirements from details that are merely nice to have. A practical choice should survive normal use, maintenance, timing, and budget. If a recommendation only works in an ideal situation, call that out plainly and give the reader a fallback path.
The simplest way to use this section is to write down the must-have criteria first, then compare each option against those criteria before weighing nice-to-have features.
Metals vs energy: 2026 outlook comparison
The 2026 commodity landscape splits into two distinct narratives. Industrial metals like copper and lithium are supported by structural demand from electrification and infrastructure, with the World Bank forecasting overall commodity prices to rise 16% this year World Bank. In contrast, energy markets are grappling with a supply glut that has pushed oil prices down through 2025, with S&P Global noting that crude is the "major exception" to the generally flat-to-upward trend in industrial commodities S&P Global.
Copper remains the bellwether for green infrastructure, while lithium faces volatility from rapid supply expansion. Oil, meanwhile, offers lower volatility but weaker growth prospects due to excess inventory Parametric Portfolio. Understanding these divergent paths is essential for portfolio positioning.
| Commodity | 2026 Direction | Key Driver | Volatility Risk |
|---|---|---|---|
| Copper | Up | Green infrastructure demand | Medium |
| Lithium | Flat to Up | EV battery adoption | High |
| Crude Oil | Flat to Down | Supply glut | Low |
The chart above tracks crude oil, reflecting the moderate, supply-driven pressure that contrasts sharply with the demand-pull dynamics seen in metals. While energy prices stabilize, metals continue to climb on structural deficits.
No comments yet. Be the first to share your thoughts!