
Commodity market trends 2026
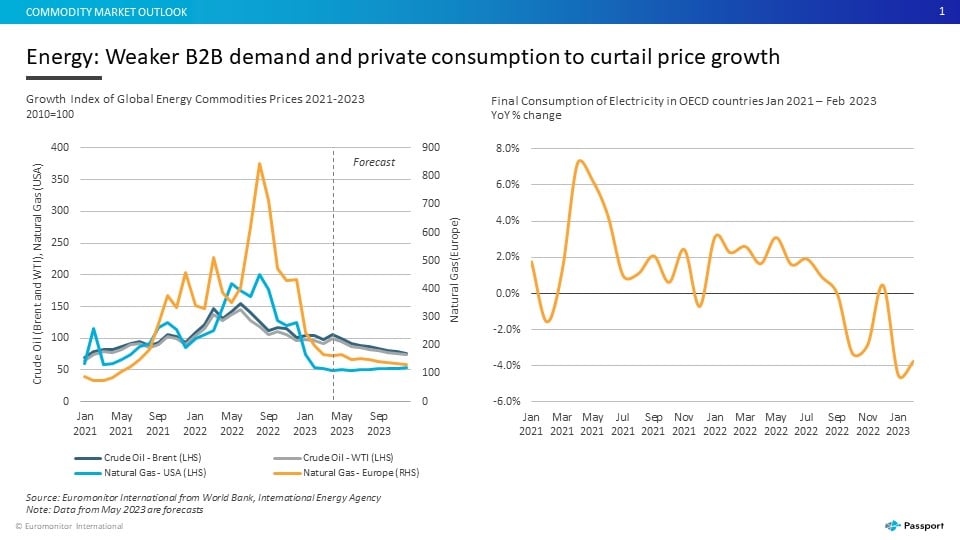
The 2026 commodity market outlook points to a significant upward trajectory, with global prices forecast to rise by approximately 16%. This surge is primarily driven by soaring energy costs and fertilizer prices, alongside record-high valuations for several key agricultural and industrial materials. These shifts are not merely cyclical; they reflect deeper structural transformations in global supply chains that are reshaping how investors approach ESG integration and risk management.
Broad commodity markets enter 2026 on a hopeful note, supported by the energy transition creating new engines of demand. As industries pivot toward decarbonization, the demand for critical minerals and sustainable energy inputs is accelerating. This structural shift provides a floor for prices even as volatility remains inherent to the asset class. Investors are increasingly looking at transparency in supply chains as a primary driver of long-term value, moving beyond simple price speculation to evaluate operational resilience.
For investors navigating this landscape, the focus is shifting from broad market bets to specific, high-conviction opportunities. The interplay between geopolitical tensions, climate-related disruptions, and technological advancements in supply chain transparency creates a complex but potentially rewarding environment. Understanding these dynamics is essential for positioning portfolios to benefit from the expected price increases while mitigating the risks associated with volatile raw material markets.
Commodity market trends 2026 choices that change the plan
Forecasting commodity prices in 2026 requires looking past headline inflation numbers. The World Bank projects aggregate commodity prices to rise by roughly 16%, driven primarily by soaring energy and fertilizer costs. This stands in contrast to earlier analyses that suggested a 7% year-over-year decline due to subdued global growth. The divergence highlights a critical tradeoff: while broad indices may soften, specific sectors are experiencing structural inflation.
Investors must evaluate which commodities are benefiting from the energy transition versus those facing demand destruction. Morganstanley notes that structural transformations are creating new engines of demand for critical minerals, while traditional fossil fuels face volatility. This split means a diversified portfolio needs to weigh exposure to green metals against traditional energy assets. The U.S. dollar’s shifting strength further complicates this landscape, impacting the purchasing power of precious metals and livestock.
To navigate these tradeoffs, consider how each asset class responds to supply chain transparency. AI-driven tracking is reducing arbitrage opportunities in agricultural commodities, potentially stabilizing prices but also capping upside spikes. For precious metals, the tradeoff is between their role as a hedge against currency debasement and their lack of yield. A balanced approach involves monitoring the spread between industrial demand and speculative positioning.
The table below compares the primary risk factors across major commodity sectors for 2026. Use this to weigh potential volatility against expected returns.
| Sector | Primary 2026 Driver | Key Tradeoff | Price Trend |
|---|---|---|---|
| Energy | Geopolitical supply constraints | Demand destruction from efficiency | Upward |
| Agriculture | Fertilizer costs and weather | Supply chain transparency limits spikes | Stable |
| Precious Metals | U.S. dollar weakness | No yield vs. inflation hedge | Volatile |
| Industrial Metals | Energy transition demand | Structural supply deficits | Strong |
Choose the next step
Commodity Market Outlook works best as a clear sequence: define the constraint, compare the realistic options, test the tradeoff, and choose the path with the fewest hidden costs. That order keeps the advice usable instead of decorative. After each step, pause long enough to check whether the recommendation still fits the reader's actual situation. If it depends on perfect timing, unusual access, or a best-case budget, include a simpler fallback.
Spotting Misleading ESG Claims
The push for AI-driven supply chain transparency has created a new layer of noise in commodity markets. Investors are told that digital traceability guarantees ESG compliance, but the reality is more fragmented. While the World Bank forecasts a 16% rise in commodity prices for 2026, driven by energy and fertilizer costs, the underlying data quality often lags behind the marketing. Morgan Stanley notes that structural transformations like the energy transition create new demand engines, but they do not guarantee that every linked product meets strict sustainability standards.
Many platforms claim real-time visibility, yet gaps remain in verifying raw material origins. Without independent audits, "green" labels can mask high-carbon extraction processes. Investors should demand third-party verification rather than relying on self-reported AI metrics. This distinction is critical for avoiding greenwashing in a market where price volatility already poses significant risks.
To navigate this, focus on companies with audited supply chains and transparent reporting. Avoid those offering vague promises of future transparency. The 2026 outlook favors those who can prove their ESG claims with hard data, not just software dashboards.
Commodity market trends 2026: what to check next
Navigating the 2026 commodity landscape requires separating structural demand shifts from short-term volatility. AI-driven transparency is changing how we track ESG compliance, but price signals remain the primary driver for most investors.
These questions reflect the core tension in 2026: balancing the tangible benefits of AI-driven supply chain visibility against the enduring unpredictability of global macroeconomic forces.
No comments yet. Be the first to share your thoughts!