
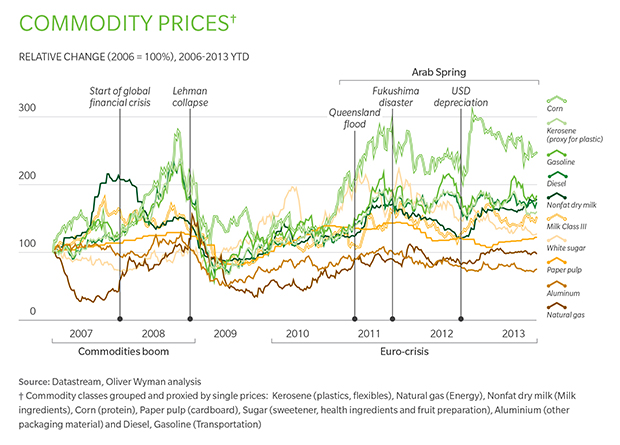
2026 commodity trends
The 2026 commodity landscape is defined by a tug-of-war between tightening supply chains and slowing global demand. While AI-driven analytics are sharpening our ability to predict these shifts, the underlying market forces remain volatile. Global commodity prices are projected to decline by approximately 7 percent in 2026, with energy prices falling even sharper at around 10 percent, according to the World Bank.
This overall dip masks significant divergence across specific sectors. Investors are not looking at a uniform market but rather at distinct pockets of opportunity and risk. The tension between geopolitical instability and fears of a global economic slowdown creates a complex environment where traditional correlations often break down.
To navigate this, it helps to look at the three primary categories driving 2026 forecasts: precious metals, industrial inputs, and energy. Each sector responds differently to the same macroeconomic pressures, requiring separate analytical lenses.
Precious metals
Gold and silver continue to attract attention as safe-haven assets. Beyond their traditional role, they are benefiting from sustained industrial demand, particularly in electronics and renewable energy technologies. Morgan Stanley notes a potentially bright outlook for these metals, driven by both investment flows and physical usage.
Industrial metals
Copper, lithium, and nickel remain critical for the energy transition, but their prices are heavily influenced by Chinese manufacturing output and infrastructure spending. As AI models incorporate real-time logistics data, the volatility in these metals is becoming more predictable, though not necessarily less intense.
Energy commodities
Oil and natural gas prices are expected to soften as global supply stabilizes and demand growth moderates. However, geopolitical disruptions can still cause sudden spikes. The 10 percent projected decline suggests a more balanced market, but one that remains sensitive to supply chain shocks.
2026 commodity trends choices that change the plan
Forecasting 2026 requires looking beyond headline prices to the structural shifts reshaping supply chains. Global commodity prices are projected to decline by about 7 percent overall, with energy prices expected to fall by 10 percent, according to the World Bank. However, this broad decline masks significant divergence between sectors. While fossil fuels face headwinds from efficiency gains and demand saturation, transition metals and precious metals are navigating a different reality driven by electrification and geopolitical hedging.
The core tradeoff for investors and supply chain managers is balancing the stability of traditional energy assets against the volatility of the green transition. Energy trading houses are pivoting to LNG and transition metals, creating a bifurcated market. You must evaluate whether to hold positions in declining conventional fuels or bet on the infrastructure build-out for renewables. The following table breaks down the primary sectors, their projected 2026 trajectories, and the key drivers influencing their valuation.
| Sector | 2026 Outlook | Primary Driver | Key Risk |
|---|---|---|---|
| Energy | Declining | Efficiency & Demand Saturation | Geopolitical Supply Shocks |
| Transition Metals | Strong | Electrification & Grid Build-out | Supply Chain Bottlenecks |
| Precious Metals | Stable/Positive | Inflation Hedging & Central Bank Buys | Strong U.S. Dollar |
| Agriculture | Volatile | Climate Events & Trade Policy | Weather-Dependent Yields |
To understand the current market sentiment, it helps to look at live price action for a representative industrial metal. Copper often serves as the bellwether for global growth expectations. A dip in copper prices can signal slowing industrial activity, while a rise suggests robust infrastructure spending.
The decision to invest in commodities for 2026 hinges on your risk tolerance regarding these divergent trends. Precious metals, particularly gold and silver, are seeing renewed interest as safe-haven assets amid geopolitical uncertainty. However, they do not generate yield like stocks or bonds. If you are seeking growth, transition metals offer higher potential returns but come with greater supply chain volatility. The choice is not about picking the "best" commodity, but aligning your exposure with your specific forecast for energy demand versus industrial electrification.
Choose the next step
Commodity Price Volatility works best when the purchase path is explicit. Verify the source, compare the offer against real alternatives, check the total cost, and confirm what happens after payment before you decide. After each comparison, write down the one risk that would change your mind. If the seller, condition, support, warranty, shipping, or upkeep still feels uncertain, resolve that question before moving to checkout.
-
Verify the sellerCheck reputation, included details, delivery terms, and return policy before treating the listing as credible.
-
Compare total costAdd shipping, accessories, maintenance, warranty, and likely replacement costs to the listed price.
-
Confirm fitMatch the option to the real use case before paying for features that will not matter.
Common Mistakes in Commodity Forecasting
AI-driven supply chain analytics have introduced new layers of complexity to market forecasting, but they also create opportunities for misleading conclusions. Several recurring errors distort 2026 commodity price volatility projections, leading investors to misjudge risk and opportunity.
Ignoring the 7% Global Price Decline
The World Bank projects a 7% decline in global commodity prices in 2026, with energy prices falling by 10%. Many AI models focus on localized supply chain disruptions while ignoring this macroeconomic deflationary pressure. Treating regional volatility as a standalone signal without adjusting for broader price trends leads to overestimation of upside potential.
Confusing Geopolitical Risk with Structural Demand
Precious metals, industrial metals, and energy are caught between geopolitical tensions and global growth slowdowns. Some forecasts attribute price movements solely to supply chain analytics or AI predictions, overlooking that demand destruction from economic contraction often outweighs supply-side shocks. This error inflates expectations for commodities like silver or gold without accounting for reduced industrial consumption.
Overreliance on Short-Term AI Signals
AI models trained on recent supply chain data may flag temporary bottlenecks as long-term trends. For example, a short-term logistics delay in copper shipments might trigger a bullish forecast, even if structural demand remains flat. Investors who act on these signals without verifying against primary source data from institutions like Morgan Stanley or the World Bank often buy into transient noise.
Assuming Silver Will Reach $200 Without Context
Speculation that silver will hit $200 in 2026 often ignores the broader commodity price decline and industrial demand weakness. While precious metals have a potentially bright outlook, this target assumes extreme supply constraints or massive industrial adoption that current data does not support. Without verifying against official forecasts, such targets remain speculative rather than analytical.
2026 commodity trends: what to check next
Investors navigating the 2026 commodity landscape face a paradox: AI-driven supply chain analytics are sharpening forecasts, yet geopolitical shocks and energy transitions keep volatility high. Before committing capital, it helps to separate structural trends from speculative noise. Below are the most common practical questions about commodity performance this year.
The interplay between AI efficiency and physical scarcity defines the 2026 market. Traders who use data to anticipate supply chain bottlenecks will likely outperform those relying on historical trends alone. Keep your exposure diversified across sectors that benefit from both technological adoption and physical demand.
No comments yet. Be the first to share your thoughts!