
Forecasting the 2026 price rebound
Understanding commodity price trends 2026 requires looking at a market split by conflicting signals. The World Bank projects a 16% rise in global commodity prices for 2026, marking the first annual increase since 2022, driven largely by persistent supply disruptions in the Middle East. This outlook suggests that energy and agricultural inputs will face upward pressure as geopolitical tensions tighten global supply chains.
However, not all major institutions agree on this trajectory. Oxford Economics forecasts a more subdued environment, predicting that commodity prices measured by the S&P Goldman Sachs Commodity Index will decline by 0.9% in 2026. This divergence highlights the uncertainty surrounding demand destruction and the pace of economic recovery in key markets. Investors must navigate these conflicting forecasts rather than relying on a single consensus.
Energy markets illustrate this volatility. S&P Global’s July 2026 review notes that crude oil price forecasts have been revised lower, with Brent expected to average $87 per barrel, down from a previous estimate of $103. This downward revision reflects concerns about weak demand offsetting supply risks. Such adjustments remind market participants that forward-looking models are constantly recalibrating to real-time data.
The PriceWidget below provides a live snapshot of the S&P GSCI, offering a real-time anchor for these broader macroeconomic trends.
Deploying AI for supply chain resilience
Commodity prices are projected to rise by 16 percent in 2026, the first annual increase since 2022, driven by energy shifts and geopolitical friction [World Bank]. To navigate this volatility, supply chain leaders must move from reactive adjustments to predictive resilience. Artificial intelligence provides the computational power to process fragmented data streams, turning uncertainty into a manageable variable.
Building a resilient supply chain in 2026 requires a structured approach to integrating AI. The goal is to anticipate disruptions before they impact the bottom line. This process involves three core operational steps.
AI systems must first aggregate external risk signals. This includes monitoring political stability in key resource-producing nations, tracking weather patterns that affect agricultural yields, and analyzing trade policy changes. By ingesting this unstructured data, algorithms can identify emerging threats to supply continuity that traditional ERP systems miss.
Once data is ingested, predictive models simulate various disruption scenarios. These models calculate the probability of port closures, route delays, or supplier bankruptcies. For example, if a model detects increased tension in a major shipping lane, it can predict a 15% increase in transit times for specific raw materials, allowing procurement teams to adjust orders proactively.

Finally, AI translates these predictions into inventory actions. Instead of holding static safety stock, systems dynamically adjust buffer levels based on real-time risk scores. This ensures capital isn't tied up in excess inventory during stable periods, while ensuring critical materials are available when volatility spikes. This lean approach protects margins against the 24% rise in energy prices also forecast for 2026 [CME Group].
Implementing this workflow requires integrating AI tools with existing procurement software. The result is a supply chain that absorbs shocks rather than breaking under them. By treating data as a primary asset, companies can stabilize costs and maintain service levels despite the shifting commodity landscape.
Tracking provenance with blockchain
AI models predict commodity price trends 2026 based on massive data inputs, but they cannot verify the physical origin of the goods they analyze. Blockchain solves this by creating an immutable ledger of ownership and movement. When AI identifies a price anomaly, you can trace the specific shipment’s history to confirm if the fluctuation is driven by genuine supply constraints or fraudulent documentation.
In high-stakes trading, this verification reduces settlement times and compliance risks. Instead of waiting days for paper trails to clear, smart contracts update status instantly as goods move through ports or warehouses. This transparency ensures that the data feeding your AI models reflects reality, not manipulated records.
To implement this, integrate blockchain nodes with your existing ERP systems. This allows your AI to cross-reference real-time physical data with financial forecasts automatically. The result is a trading environment where price signals are trusted because the underlying asset history is verified.
Analyzing key asset class movements
Navigating commodity price trends 2026 requires separating structural shifts from seasonal noise. The market is pricing in a divergence between energy, metals, and agriculture, driven by AI infrastructure demand and climate volatility. Use the framework below to map your exposure against the 2026 baseline forecasts.
Energy: The Demand Rebalance
Brent crude forecasts have been revised downward, with S&P Global projecting an average of $87/b for 2026, a significant drop from previous $103/b estimates. This adjustment reflects a global demand rebalance rather than a collapse. The market is absorbing supply gains from non-OPEC producers while efficiency gains in key economies temper growth expectations. For investors, this signals a period of range-bound volatility rather than a sustained bull run.
Metals: The Green Premium
Industrial metals are decoupling from general economic cycles due to the electrification of transport and data center construction. Copper and aluminum are facing supply constraints as new mine development lags behind the build-out of renewable energy grids. This structural deficit supports higher price floors, even if short-term demand fluctuates. The AI-driven shift in energy infrastructure acts as a persistent bid for these specific metals.
Agriculture: Climate as the Variable
Agricultural commodities remain sensitive to weather patterns, with drought conditions in key growing regions posing a risk to yields in 2026. Bloomberg Insights notes that persistent drought could lead to lower crop yields and higher prices, particularly for soft commodities. Unlike energy and metals, which have clearer demand drivers, agriculture prices are dictated by supply shocks. Monitoring precipitation data is more critical than tracking macroeconomic indicators for this sector.
| Sector | 2026 Outlook | Primary Driver | Volatility Profile |
|---|---|---|---|
| Energy | $87/b Brent avg. | Demand rebalance | Moderate |
| Metals | Structural deficit | Green infrastructure | High |
| Agriculture | Weather-dependent | Drought risks | Very High |
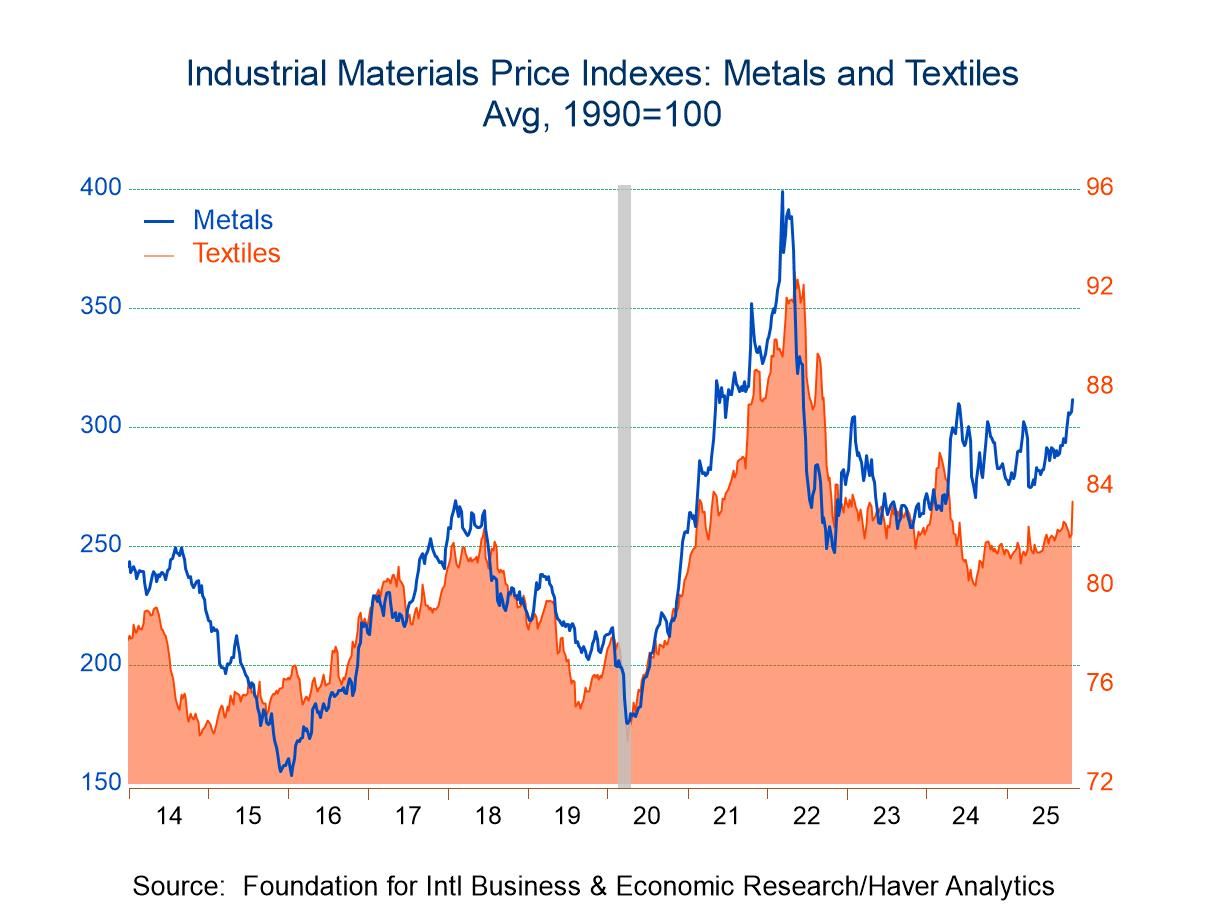
The industrial commodity price index has shown resilience in recent weeks, edging higher despite broader market uncertainty. This trend underscores the strength in physical demand for raw materials, even as financial markets debate the pace of global growth. Use this data to validate your sector allocation against the 2026 forecasts.
Building a resilient trading checklist
The 2026 commodity landscape demands more than intuition; it requires a structured audit of your supply chain and trading protocols. With global prices forecast to rise 16% this year, primarily due to Middle East supply disruptions, the cost of inaction has never been higher [[src-serp-1]]. You need a concrete framework to navigate these volatile commodity price trends 2026.
Start by mapping your exposure to geopolitical hotspots. Identify which raw materials in your portfolio rely on single-source suppliers in unstable regions. Next, integrate AI-driven volatility models to stress-test your inventory levels against potential shipping delays. These tools can predict price spikes before they hit the spot market, allowing you to hedge effectively.
Finally, verify your blockchain traceability systems. As regulatory scrutiny on supply chain transparency increases, having immutable records of origin is no longer optional—it is a competitive advantage. Use the checklist below to ensure your operations are audit-ready.
-
Map supplier dependencies against current geopolitical risk zones
-
Deploy AI forecasting models for 30-90 day price volatility
-
Audit blockchain traceability for top 5 critical raw materials
-
Review hedging strategies against 16% price rise scenario
-
Test emergency procurement protocols for single-source items
Common questions on 2026 markets
Navigating commodity price trends 2026 requires separating algorithmic noise from structural shifts. AI and blockchain are reshaping trade finance and price discovery, but they do not override fundamental supply and demand. Use the following clarifications to anchor your strategy.
For detailed forecasts, refer to Oxford Economics and Trading Economics for data-driven insights.
No comments yet. Be the first to share your thoughts!